Business Opportunities
- HOME
- Why Japan?
- Business Opportunities
Opportunities for
Investment Activities
Japan Exchange Group (JPX) aims to continue to be one of the world’s pivotal markets while focusing on creating greater convenience for overseas investors.
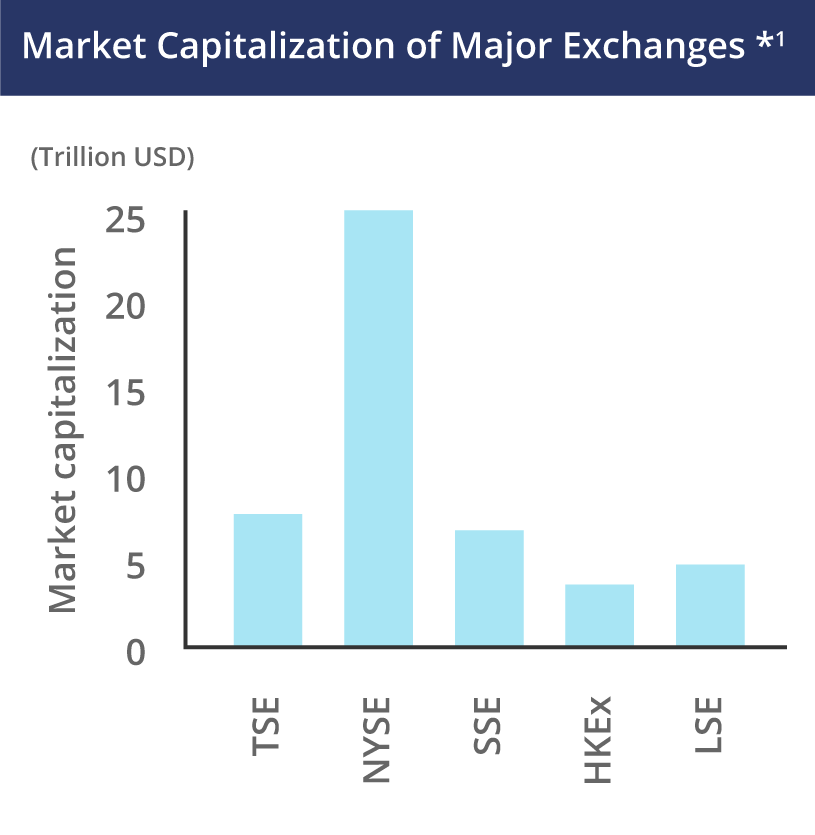
Among its markets, Tokyo Stock Exchange (TSE) is one of the world’s leading exchanges by market capitalization of listed companies. TSE promotes initiatives that enhance the corporate values of listed companies.
Source:
- 1. Nomura Institute of Capital Markets Research (compiled by FSA)
- 2. Nomura Institute of Capital Markets Research. ≪Stock Market≫ Each Type of Market Shift, Winter 2019
- 3. World Federation of Exchanges. Market Statistics, March 2020.
In April 2022, TSE restructured its market segments from five to three. Over 90 percent of listed companies on the Prime Market are implementing disclosure in English, and all listed companies will be required to release important information in English beginning April 2025. Higher levels of corporate governance code have also been applied. As a result, the values of listed companies are expected to further increase.
Old market segments
1st Section
Mothers
2nd
Section
New market segments
-
Prime
MarketFor companies that concentrate on constructive dialogue with global investors
-
Standard
MarketFor companies that have sufficient liquidity and governance levels to be investment instruments
-
Growth
MarketFor companies that have high growth potential
A total of 327 ETFs are listed (as of June 4, 2024), including Japanese thematic ETFs (including ESG-related issues) and foreign stock and bond ETFs. The Market Making Incentive Scheme was introduced in 2018, and liquidity has improved as the system continues to be revised. (The figure shows an example of improved liquidity for sector-specific ETFs.)
Example of improved liquidity:
“Change in ETFs’ order book situation by sector.”
The order book situations for industry-specific ETFs have clearly improved since the Market Making Incentive Scheme Ver. 2.0 designations.
- Average spreads have narrowed (approx. from 30 bps to 16 bps)
- The displayed quantities on the best bids and offers have doubled (from just under 10 million yen to over 20 million yen)
Shifts in the states of displayed quantities of sector-specific ETFs (average of 17 issues each)
* “Best executable quote amount” refers to a time-weighted average of only the best prices among the quoted amounts. As such, if quotes besides the best are included, the actual executable amount becomes larger.
There are also abundant investment opportunities in private markets.
Private equity investments in Japan are increasing. While equity carve-outs and de-listings are gaining attention in large scale projects, business succession by owners and founders is doing the same in small and medium scale projects.
Figure 1: Monetary amounts and number of domestic investment deals involving PE funds (by sector)
Source: Trends in Japan’s private equity market and related considerations - 2022
Note: The amount of information disclosed in relation to investment amounts is limited. This figure does not include investments of an undisclosed amount.
Figure 2: Trends in dry powder of PE funds with an interest in Japan
Furthermore, investments in start-ups in Japan are rapidly increasing; the investments made by overseas corporations are particularly remarkable.
Note:
- 1. As of January 25, 2022. (The values given for each year are those observed up to the base date.)
- 2. Start-ups in Japan are unlisted companies (including companies started in Japan by non-Japanese people, and companies started overseas by Japanese people), as well as other companies defined as “start-ups in Japan” by Uzabase, Inc.
- 3. “Business corporations” does not include CVC. “Overseas corporations” includes overseas financial institutions as well as overseas business corporations. “Others” includes SPCs (Special-Purpose Company), crowdfunding, local governments, universities, foundations, and other funds and unspecified entities.
- 4. Investment amounts include conjecture by Uzabase, Inc.
Source: Uzabase, Inc., Japan Startup Finance 2021: Japan Startup Funding
Opportunities for Asset Raising
& Sales Activities
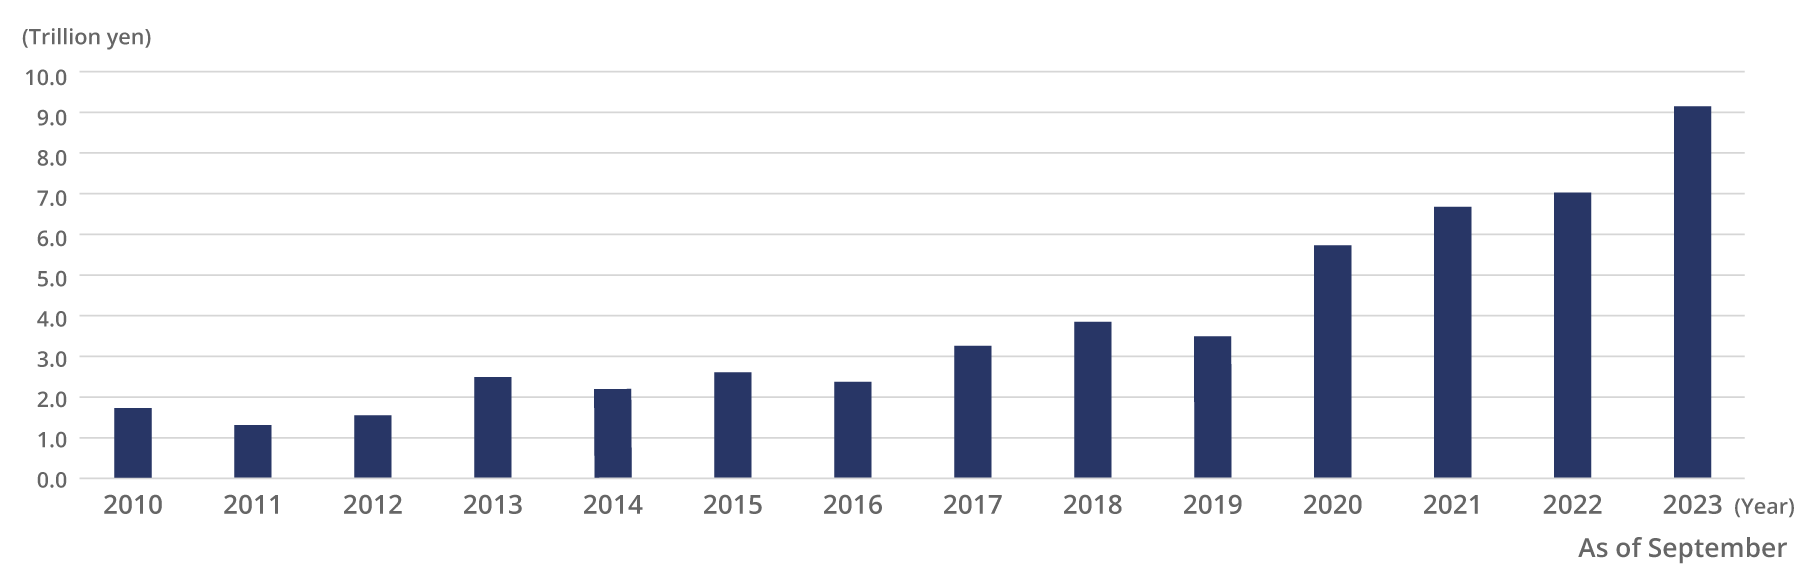
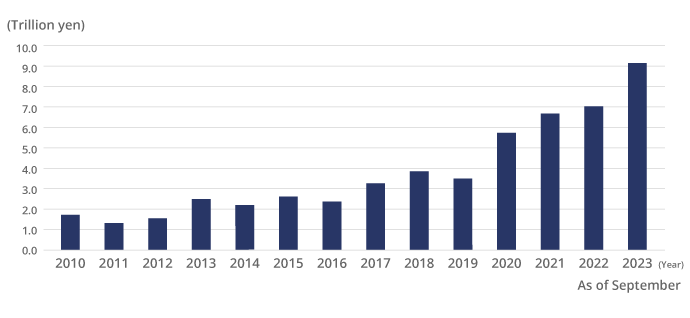
Japan on the whole has seen a significant increase in its assets under management. Japan also holds a wealth of individual financial assets, which are a great source of potential.
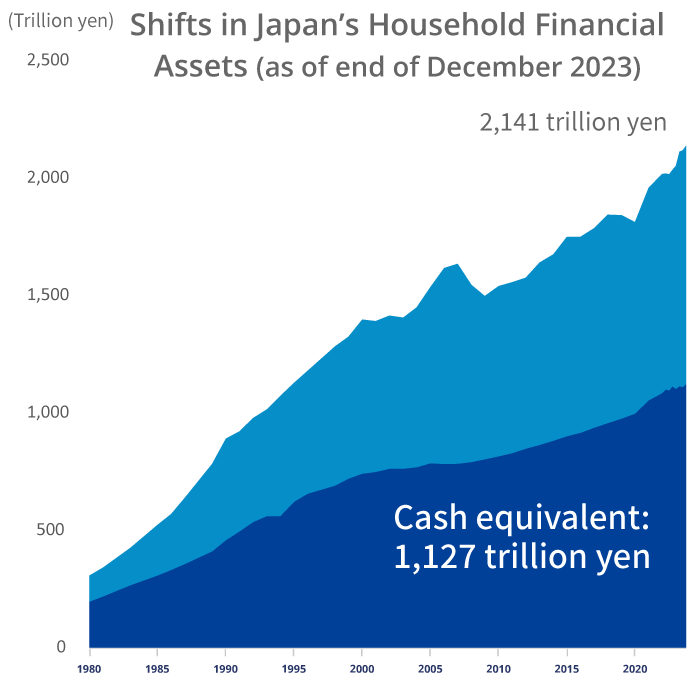
Source: Created by FSA from data provided by the Bank of Japan
Note: The figures include investments in trust (private/public) and discretionary accounts; they exclude price fluctuations.
Source: Bank of Japan & Japan Investment Advisers Association
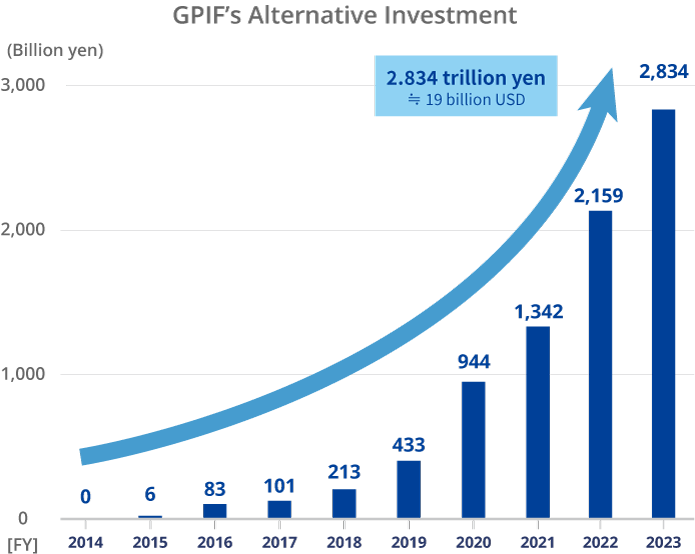
The asset compositions of Japan’s institutional investors are changing. For example, the Government Pension Investment Fund (GPIF) has greatly expanded its investments in alternative assets.
Note: The figures include investments in infrastructure, private equity, and real estate.
Source: GPIF
Note: The figures include investments in infrastructure, private equity, and real estate.
Source: GPIF
Against this backdrop, overseas asset management firms have become able to enter the Japan market through registering in English.
Additionally, from July 2022 the requirements for an individual to become a professional investor have become more elastic, facilitating the solicitation of individual investors.
Furthermore, initiatives to promote the outsourcing of middle and back office operations, relax entry conditions, and facilitate the solicitation of new investment managers are planned to take effect.